Infographics for a research report about (trans) violence.
Infographics for a reasearch report about transsexual violence.
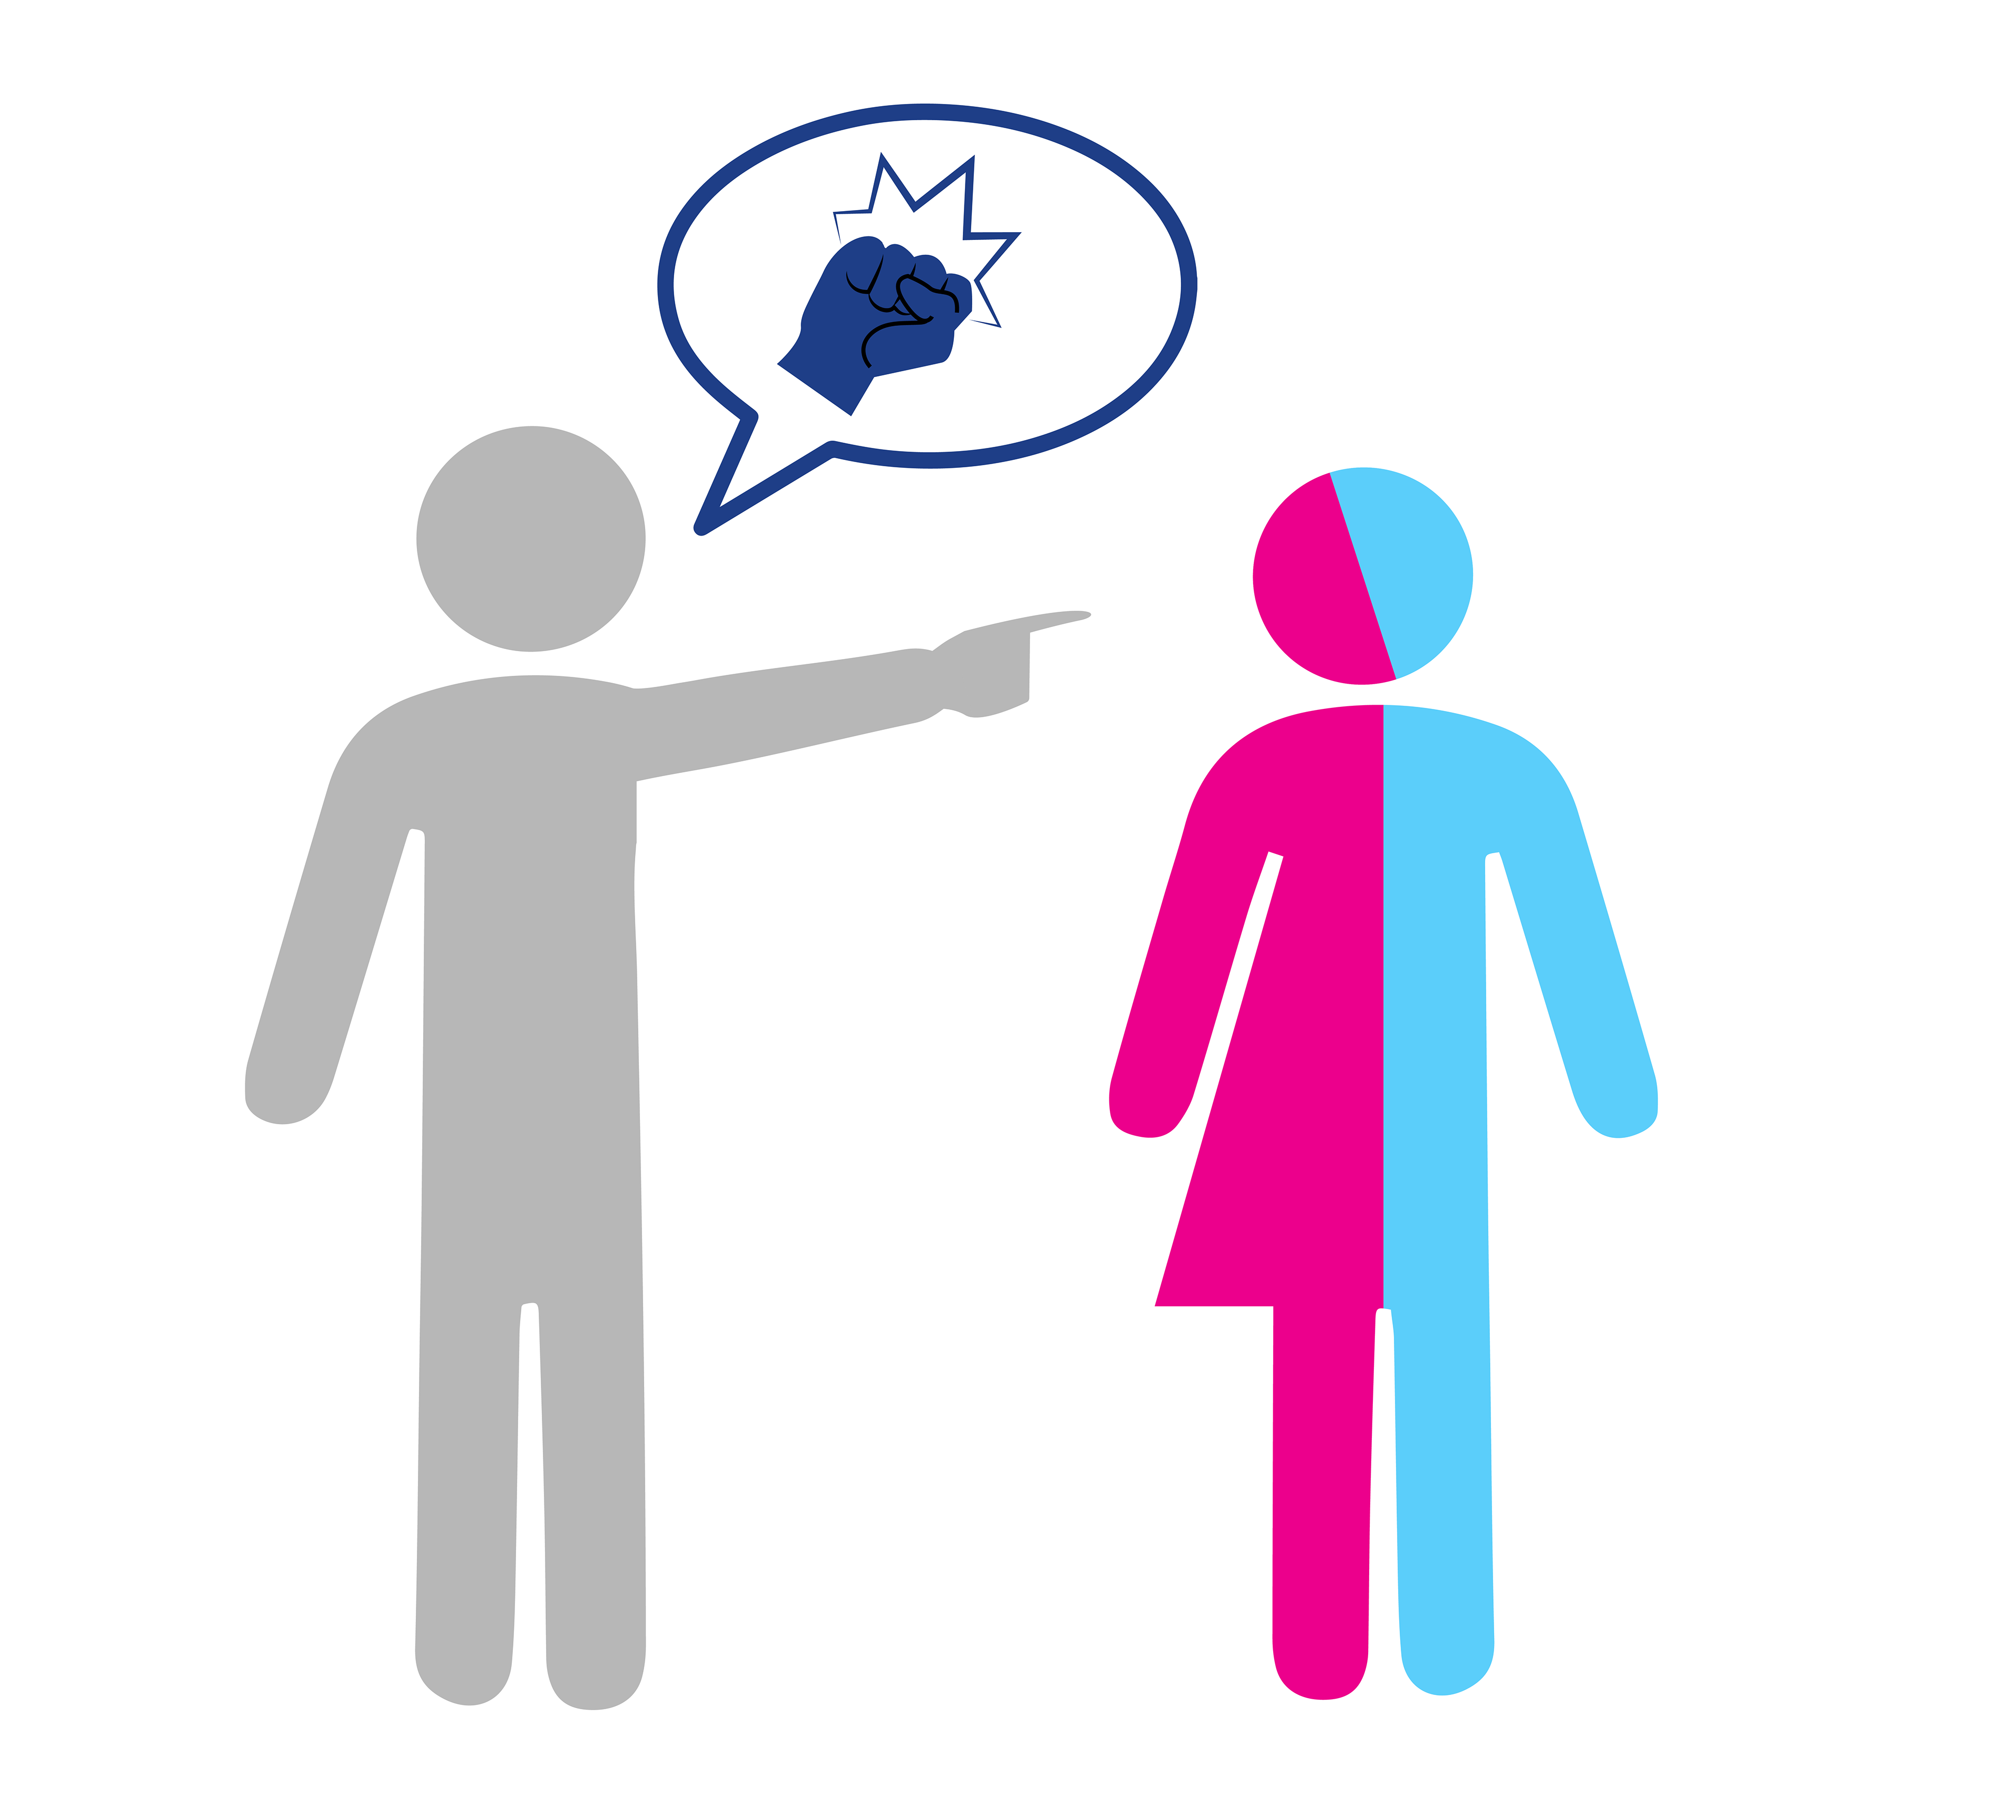
How I made it: The company had used somewhat similar looking infographics in the past, but with inconsistent colors. So I took a lot inspiration from those. In cooperation with the team, I decided to use simple stick figures with different coloring: (grey: gender is irrelevant to the situation, light blue: male, pink: female, gradation from pink to blue: transgender)
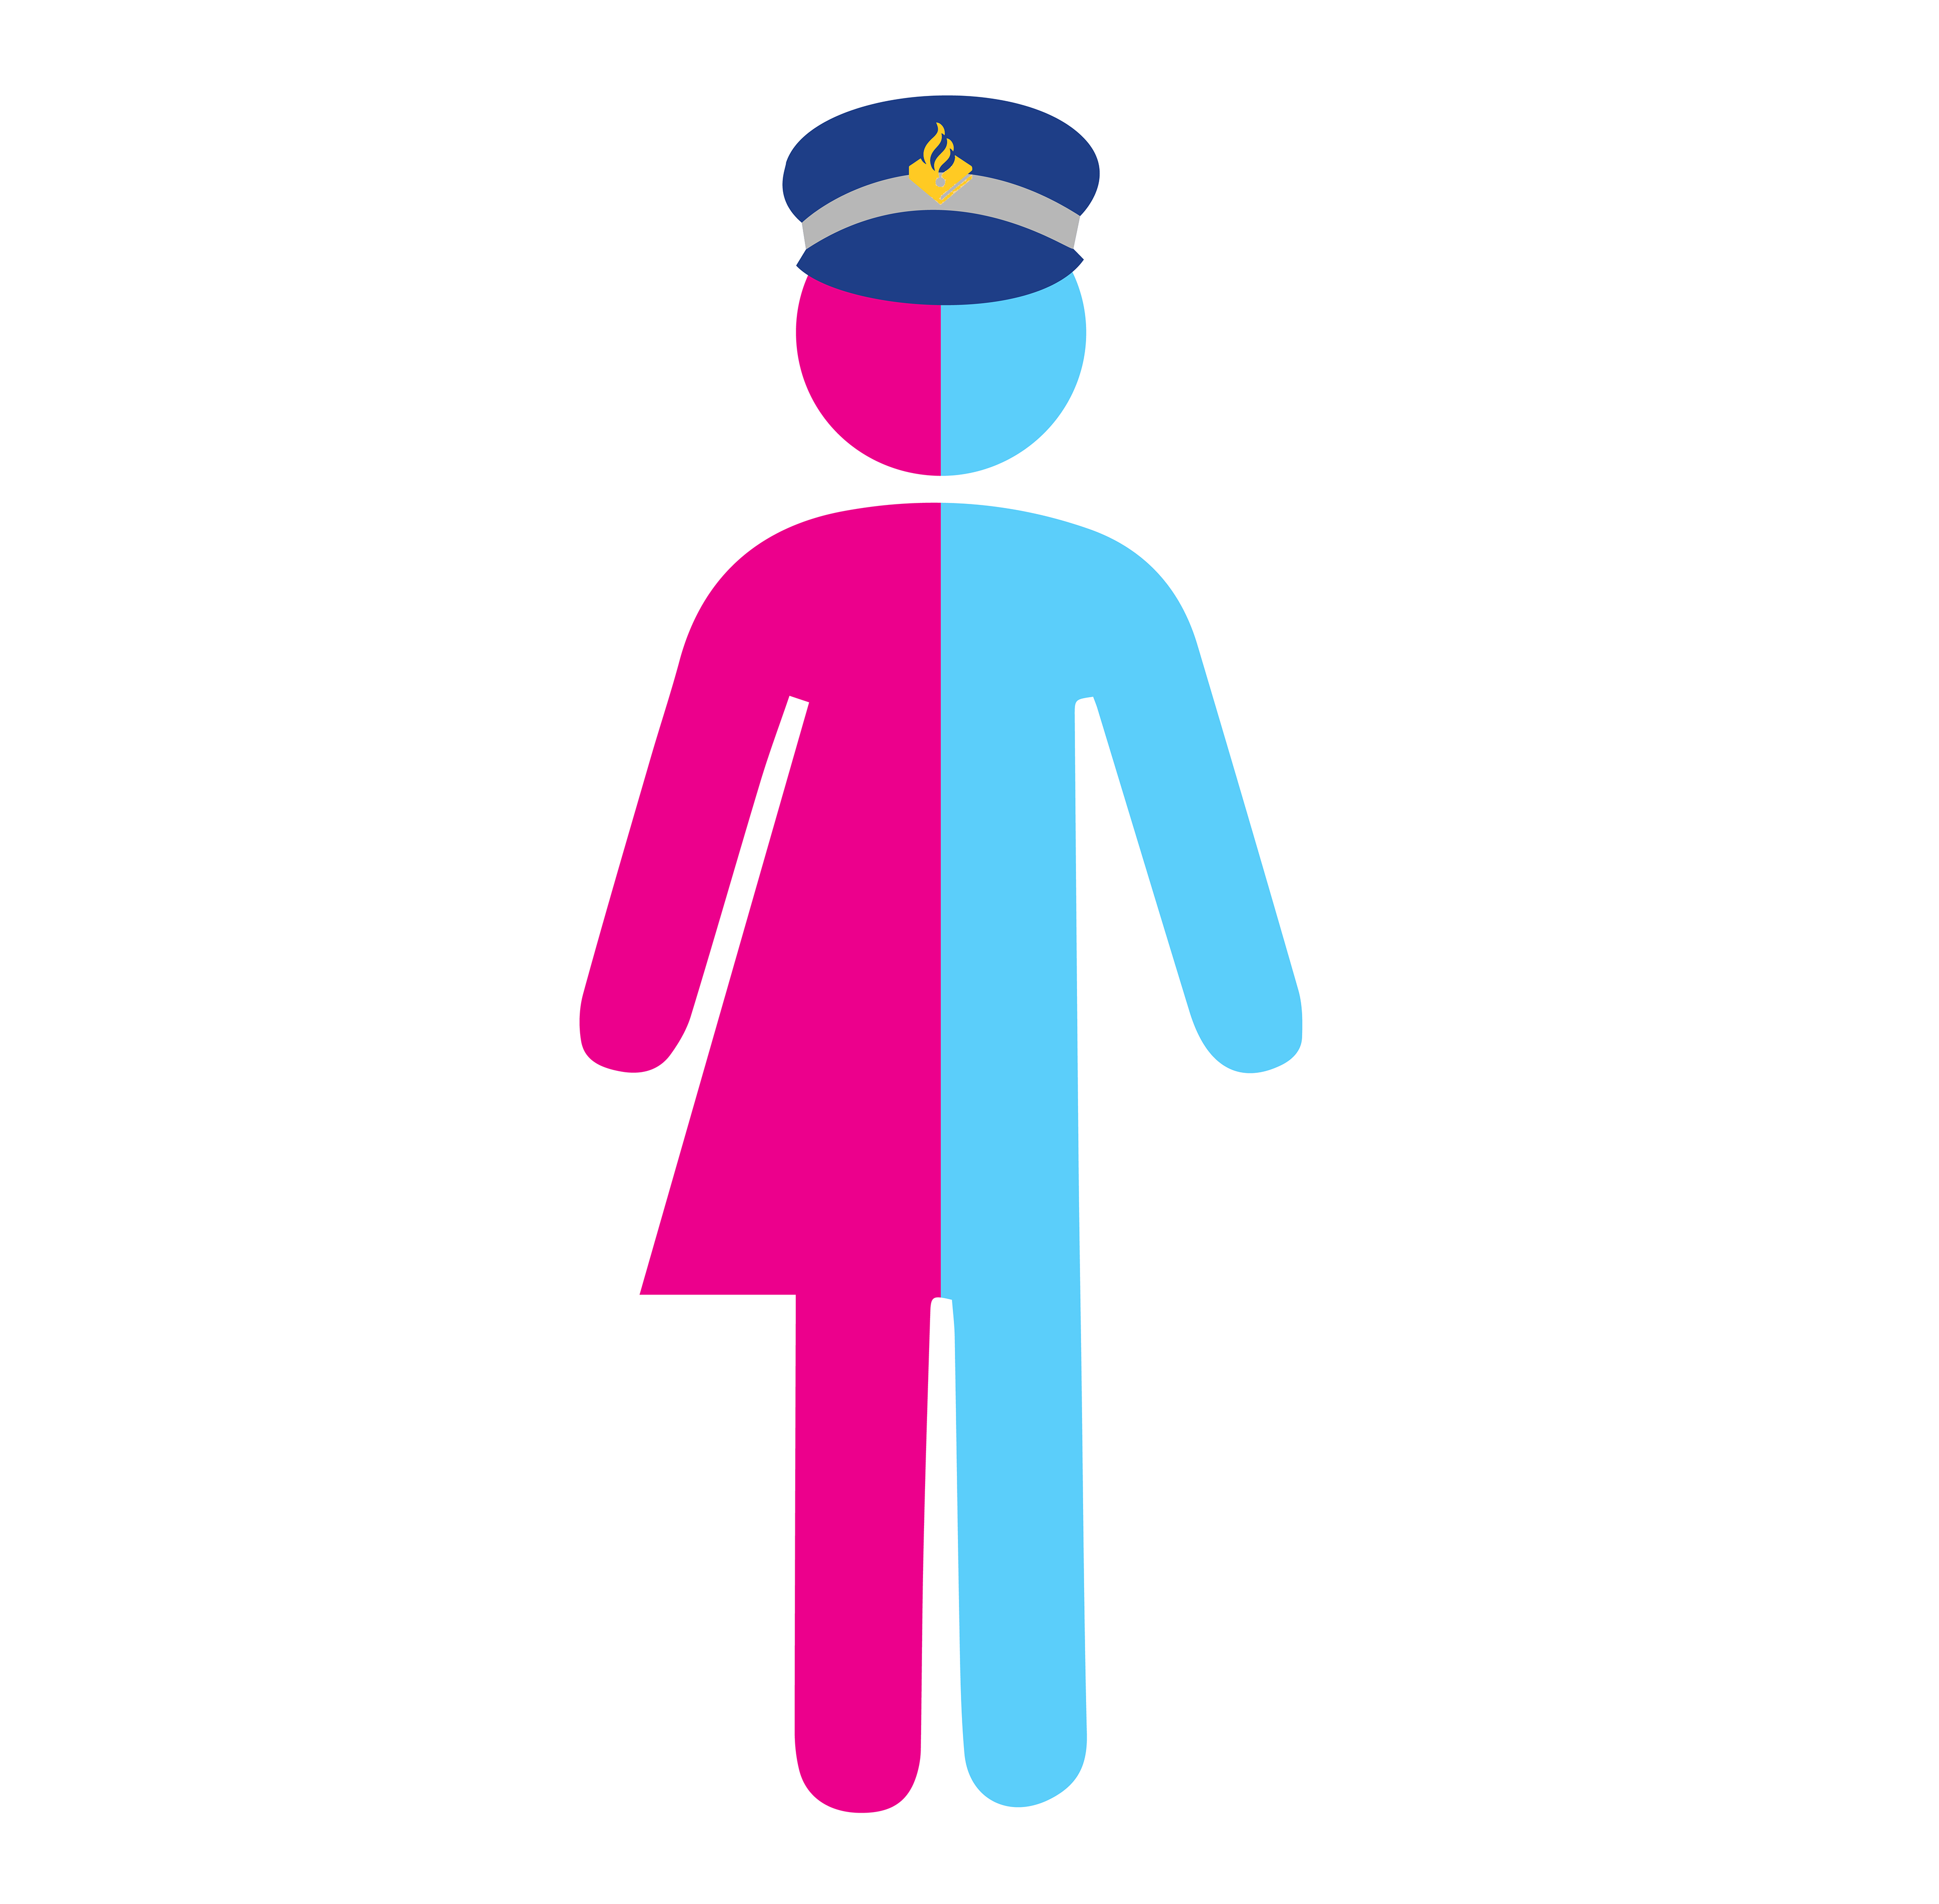
I made a few versions for the the coloring of the stick figures: first I only had a male, female and a transgender version, but after discussions with the team added a grey stickfigure, which represents a person in which the gender is irrelevant. The first iteration of the transgender figure was 50% pink and 50% blue. But after some discussion with the team decided to change it to a gradation from pink to blue, because not all transgender people are gender binary.
These stick figures can assume different arm/ leg positions to convey a different action being performed. Ass well as wear or carry different attributes.
Who I worked with: Elise van Alphen, Nora Uitterlinden
Willingness to declare crimes to the police

destroying of pesonal belongings

physical violence

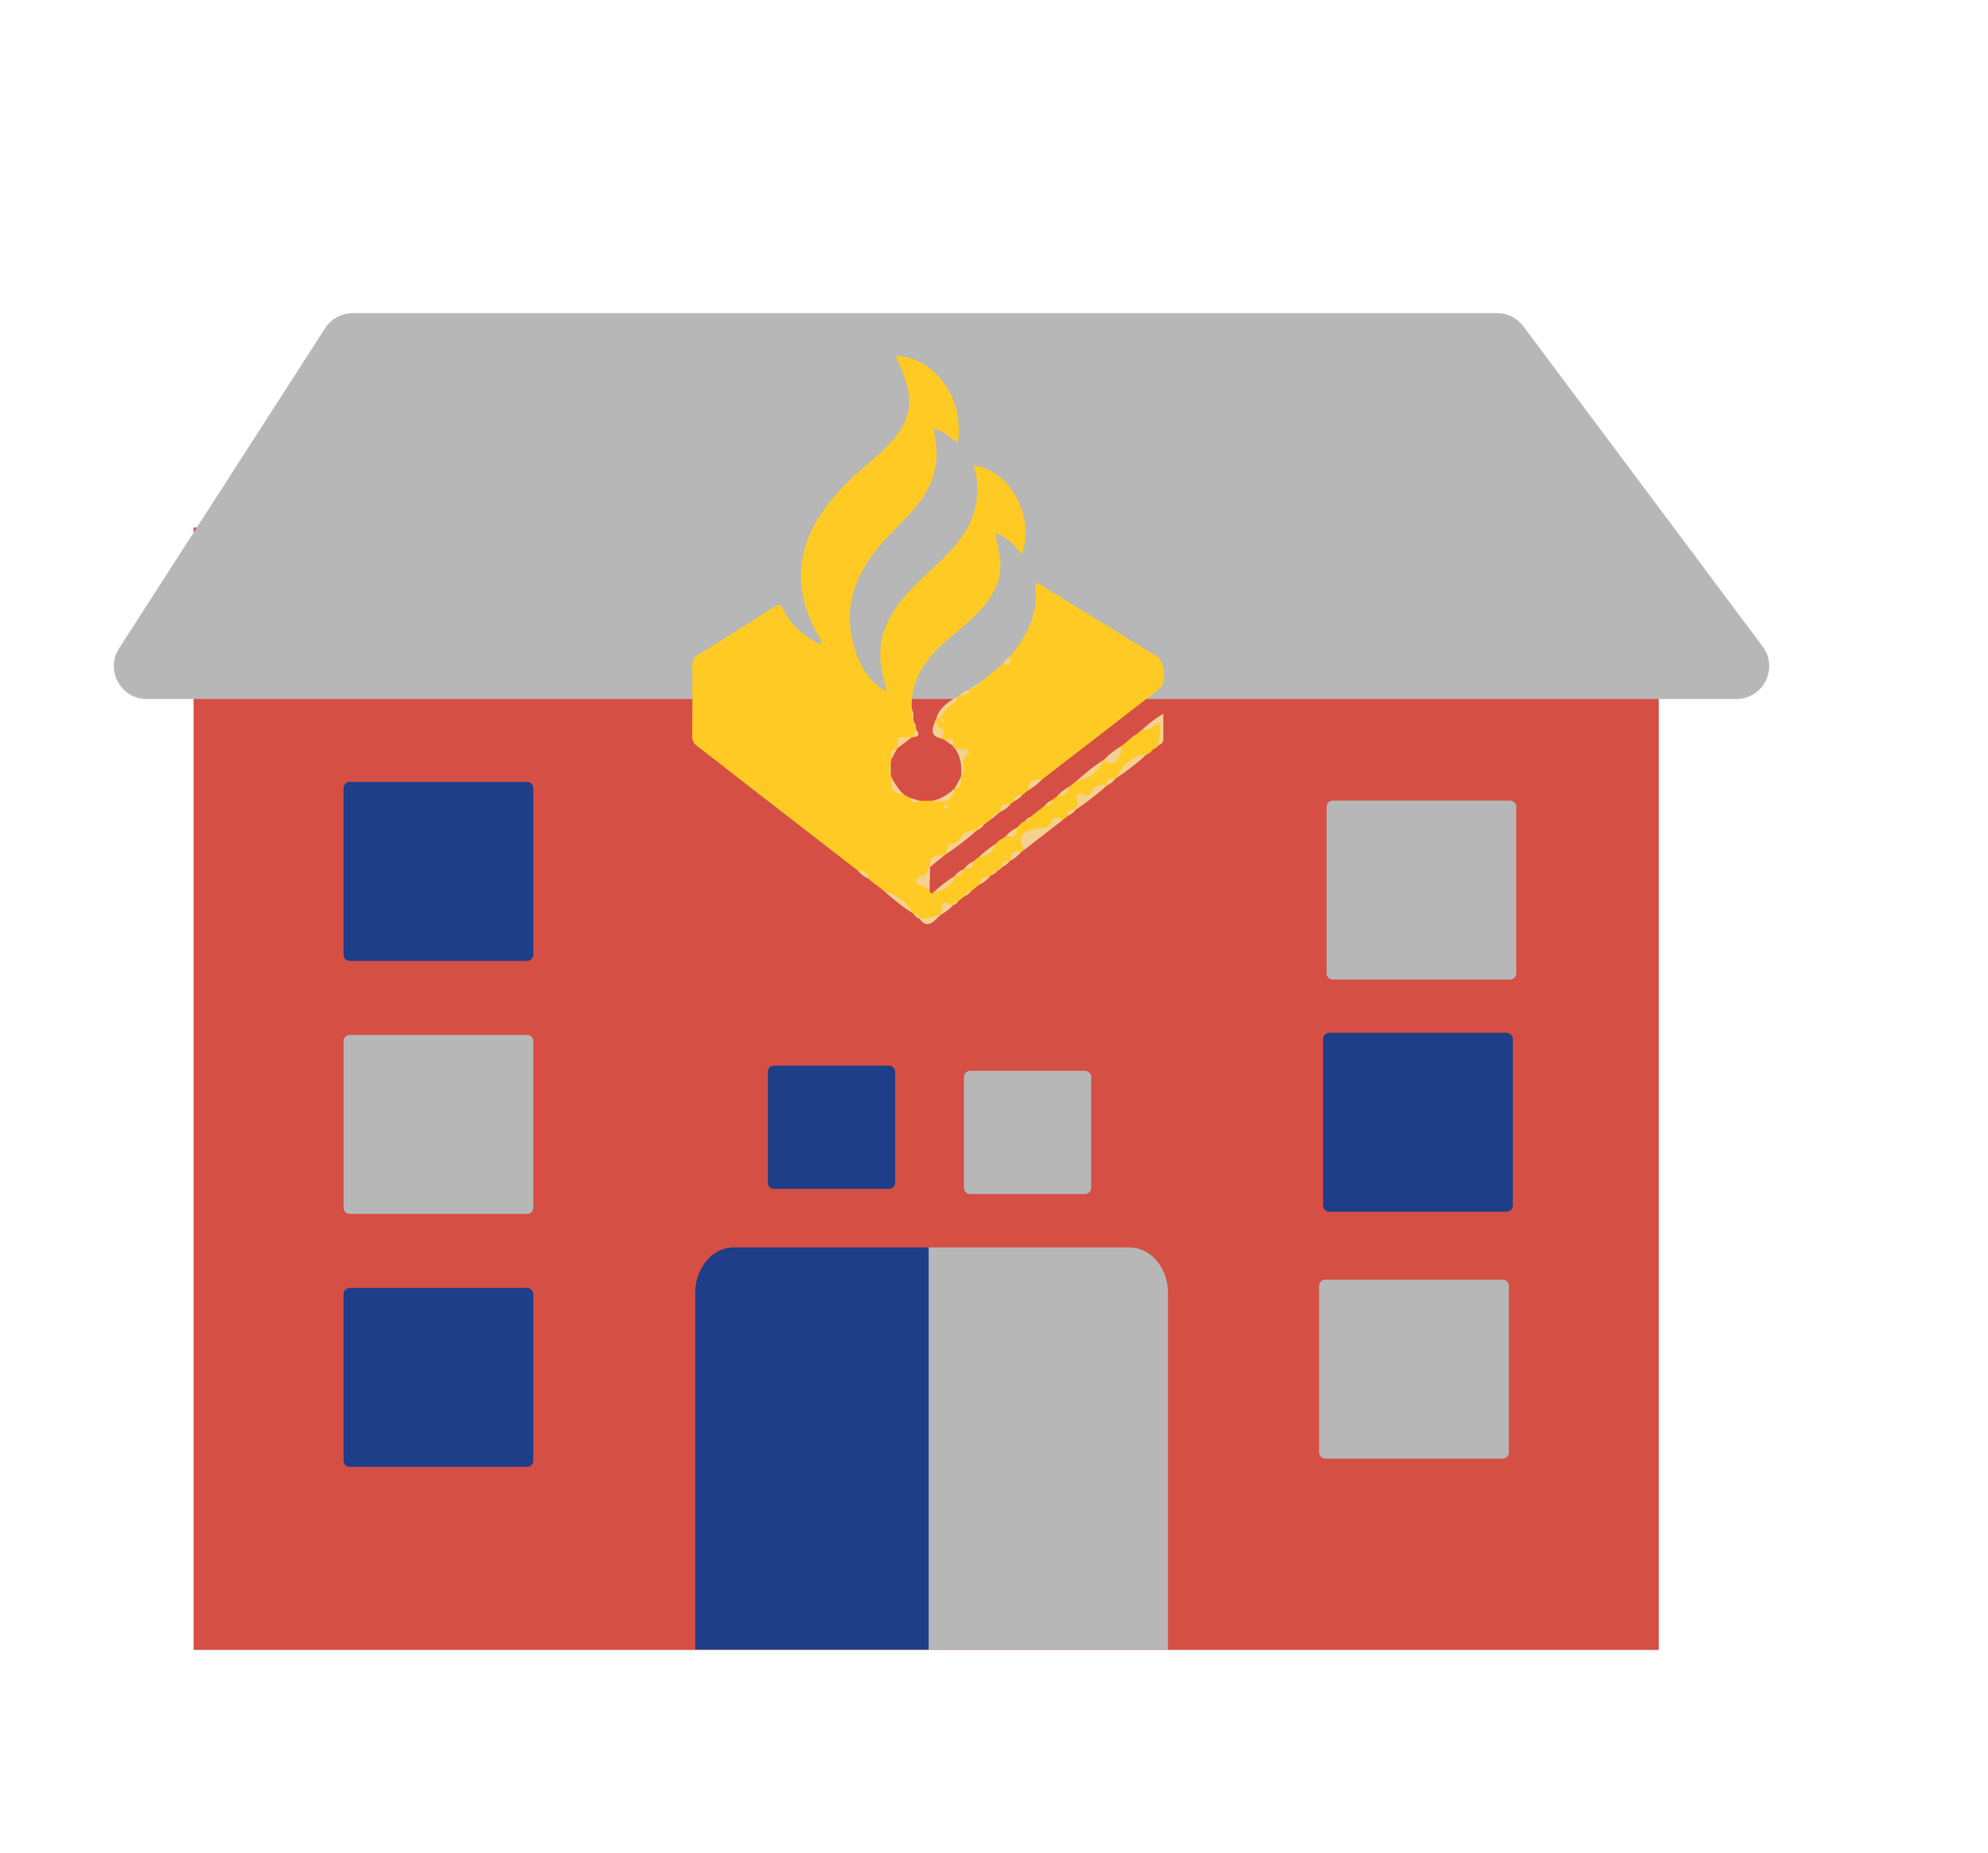
Domestic violence

Online violence

sexual violence (trans)
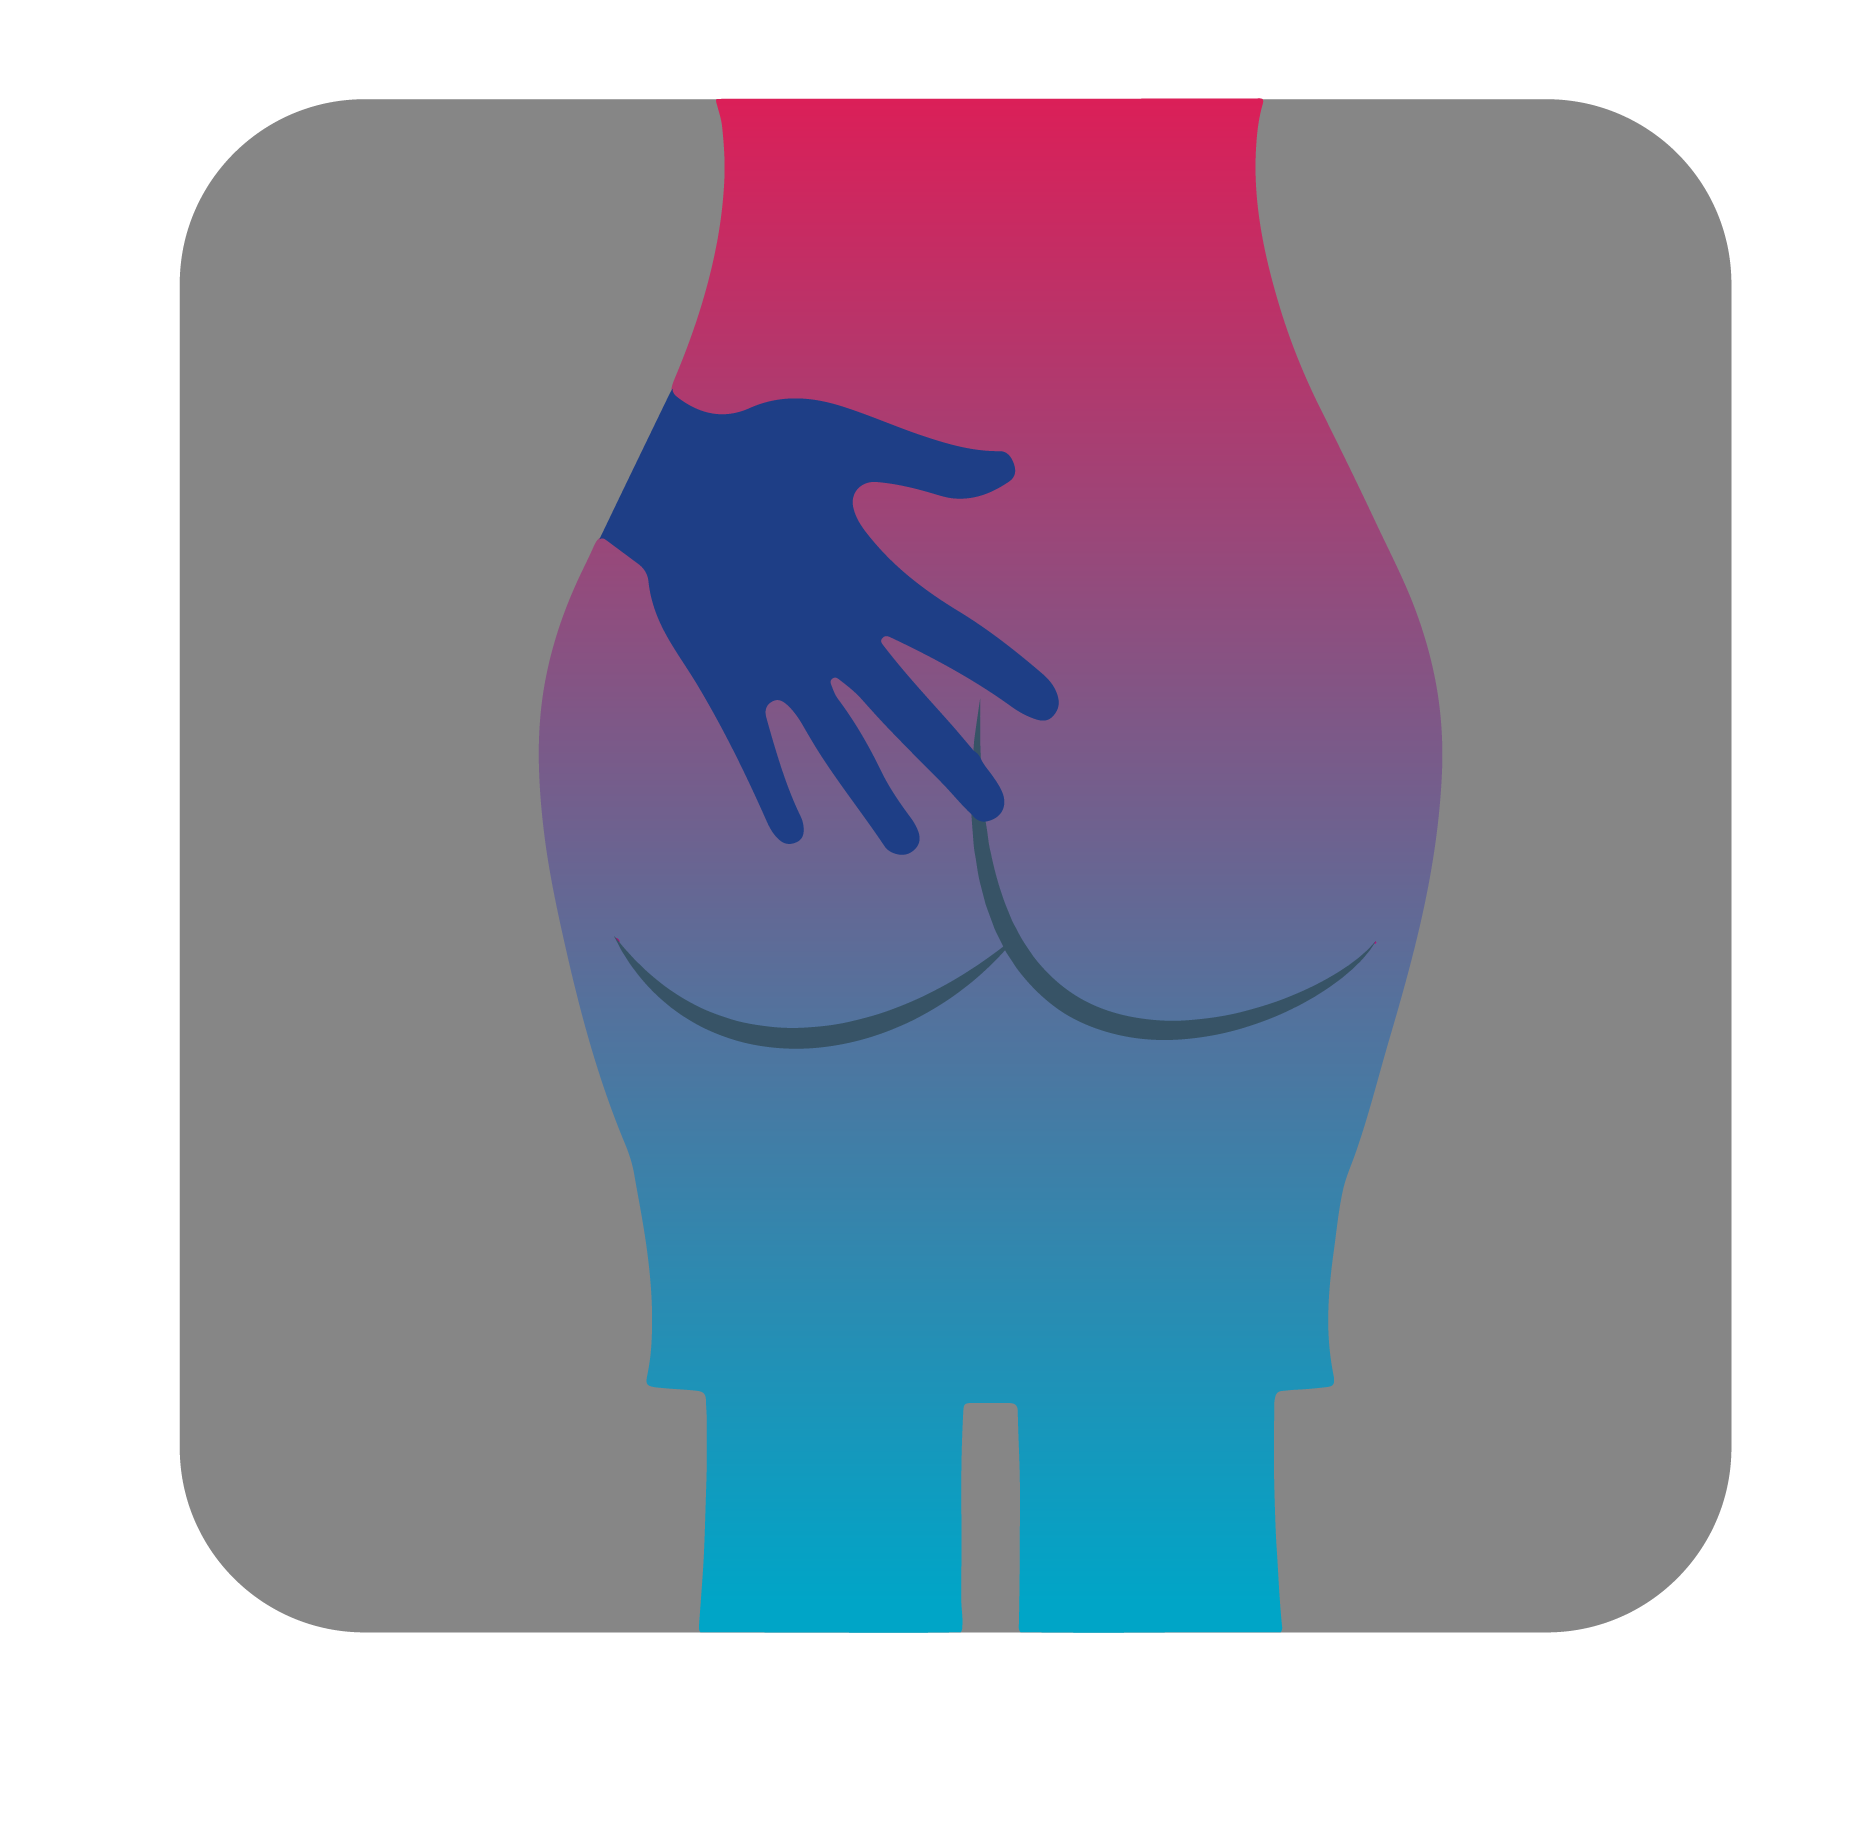
sexual violence

Infographics for an animation movie for the police.
Police hands across eachother

Trans report crime to police
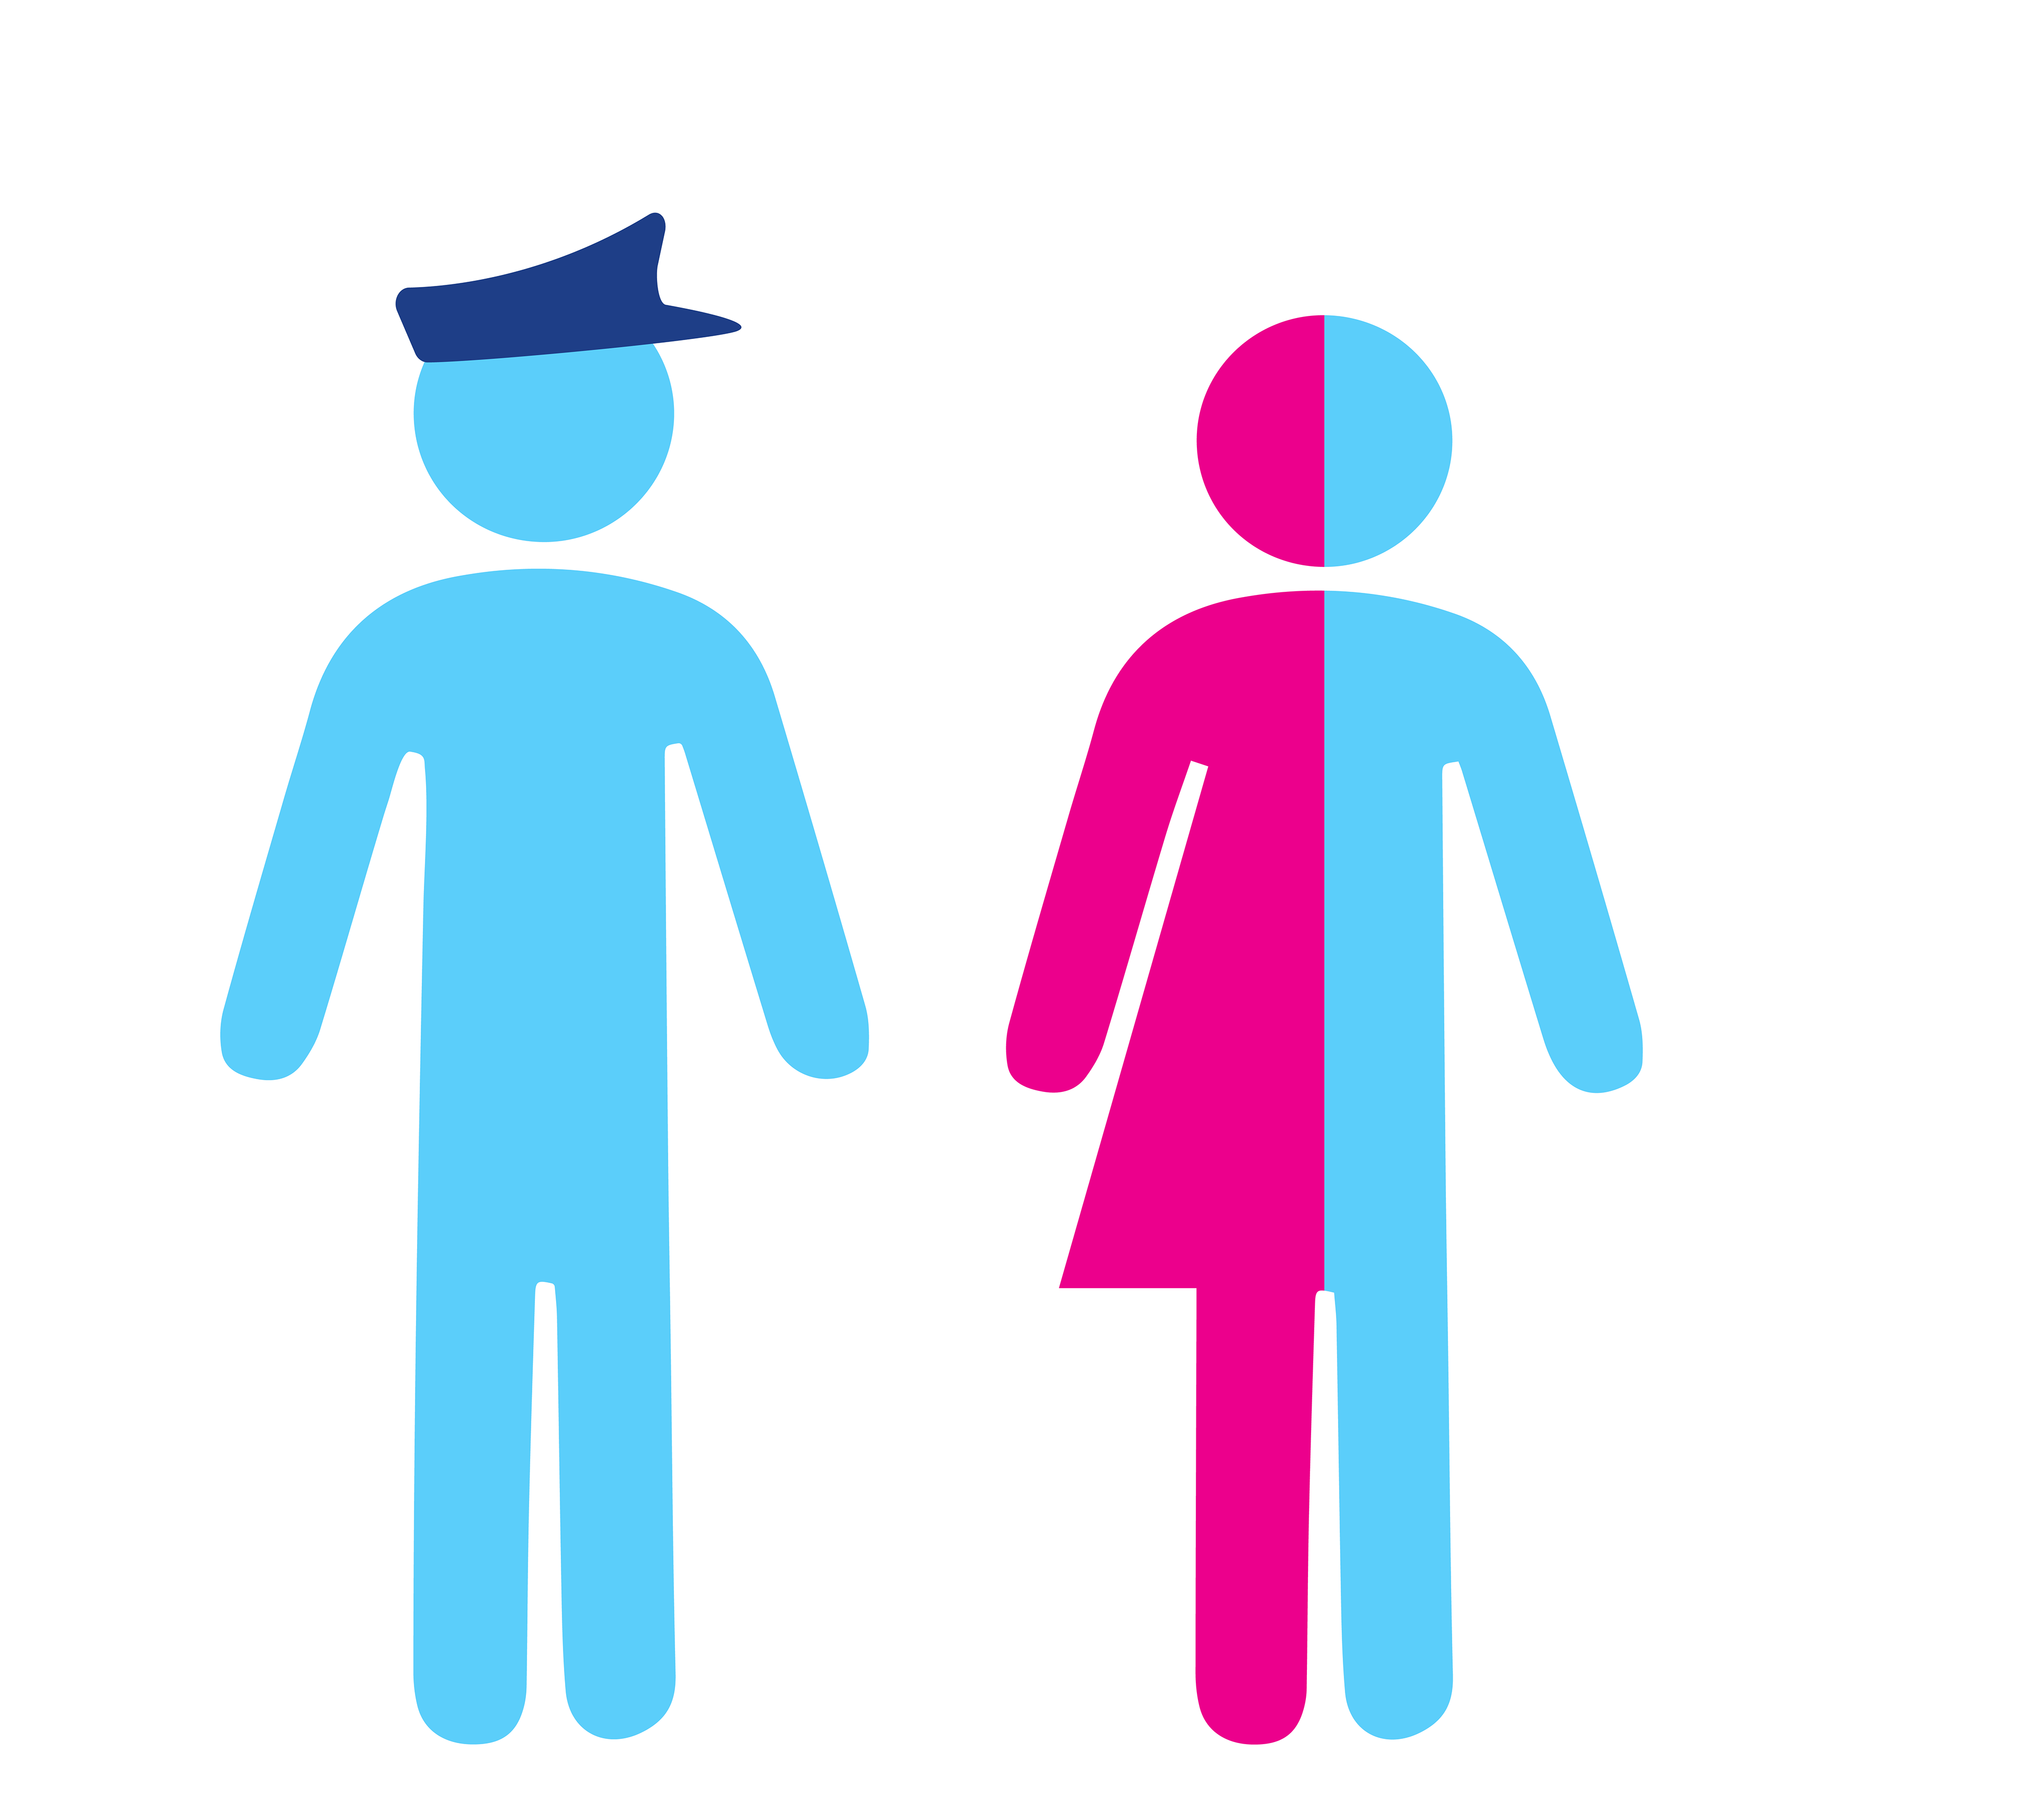
Police normal

trans reporting crime

Trans panic

trans police
Trans fired

verbal violence
verbal violence